PlantUML Diagram types
Here’s a summary of PlantUML APIs and syntax for different diagram types, along with key elements to get you started:
Here’s a summary of the key syntax and APIs for different diagram types in PlantUML:
General Structure: Most diagrams start with @startuml and end with @enduml Some specific diagrams have unique start/end tags (e.g., @startmindmap/@endmindmap)
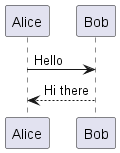
1. Sequence Diagrams
Purpose: Show interactions between objects in a chronological order.
Key Elements:
- Use
->for messages between participants - Use
-->for dotted arrows - Declare participants with
participant,actor,boundary,control,entity,database, etc.
    @startuml
        Alice -> Bob: Hello
        Bob --> Alice: Hi there
    @enduml
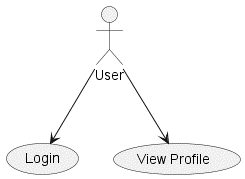
2. Use Case Diagrams
Purpose: Show how actors interact with a system.
Key Elements:
- Define actors with :Actor:
- Define use cases with (Use Case)
- Show relationships with -> or —>
    @startuml
        :User: --> (Login)
        :User: --> (View Profile)
    @enduml
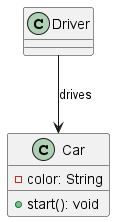
3. Class Diagrams
Purpose: Show classes and their relationships (associations, inheritance, aggregation).
Key Elements:
- Define classes with
class ClassName - Show relationships with arrows like
--,<|--,*--,o--
    @startuml
        class Car {
        -color: String
        +start(): void
        }
        class Driver
        Driver --> Car: drives
    @enduml
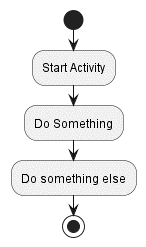
4. Activity Diagrams:
Purpose: Show the flow of activities within a process.
Key Elements:
- Use
startandstopfor beginning and end - Use
if,else,endiffor conditionals - Use
whileandendwhilefor loops
  @startuml
    start
    :Start Activity;
    :Do Something;
    :Do something else;
    stop
  @enduml
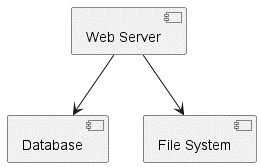
5. Component Diagrams:
Purpose: Show the components of a system and their dependencies.
Key Elements:
- Define components with
[Component] - Show interfaces with
() "Interface"
  @startuml
    [Web Server] --> [Database]
    [Web Server] --> [File System]
  @enduml
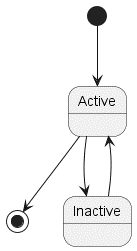
6. State Diagrams:
Purpose: State diagrams visualize the different states an object can be in and the transitions between those states. They are helpful for understanding the behavior of objects over time.
Key Elements:
- Define states with
state StateName - Show transitions with
-->
  @startuml
    [*] --> Active
    Active --> [*]
    Active --> Inactive
    Inactive --> Active
  @enduml
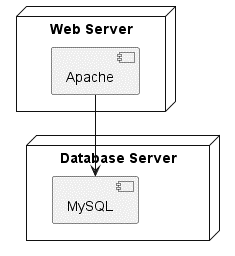
7. Deployment Diagrams:
Purpose: Show the physical layout of a system’s components.
Key Elements:
- Define nodes with
node NodeName - Show artifacts with
artifact ArtifactName
    @startuml
        node "Web Server" {
        [Apache]
        }
        node "Database Server" {
        [MySQL]
        }
        [Apache] --> [MySQL]
    @enduml
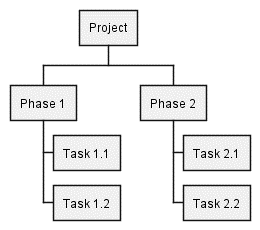
8. Work Breakdown Structure (WBS):
Purpose: A WBS diagram visually breaks down a project into smaller, manageable tasks or deliverables. It helps to visualize the scope of work, dependencies, and relationships between tasks.
Key Elements:
- Start with
@startwbsand end with@endwbs - Use
*for the root node and**,***, etc. for child nodes - Use
+instead of*for alternative notation
  @startwbs
    * Project
    ** Phase 1
    *** Task 1.1
    *** Task 1.2
    ** Phase 2
    *** Task 2.1
    *** Task 2.2
  @endwbs